
無料かつオンラインで統計ビデオを作成する
ビデオを通じて統計を表示することは、データと観点を視覚的に提示する最も直接的な方法です。FlexClipのオンライン統計ビデオメーカーは、共有に値する統計ビデオを作成するために必要なすべてを提供し、プロセスを簡単にします。プロのテンプレート、豊富なメディアストック、有効的な編集ツールなどから選択し、説得力のある統計ビデオを自由に作成できます。ぜひ無料でお試しください!
無料動画を作る 便利なビデオエディタ
 リッチな動画テンプレート
 豊富なメディアライブラリ
 ダイナミックなテキストアニメーション
- Trusted by:


無料で使えるプロな統計ビデオテンプレート
 プレビューカスタマイズ
現代の会社レポートのサンプル
 プレビューカスタマイズ
事業報告書
 プレビューカスタマイズ
リサーチレポートプレゼンテーション
 プレビューカスタマイズ
プロの年次会社レポート ビジネス ビデオ
 プレビューカスタマイズ
第1四半期レポート
 プレビューカスタマイズ
ビジネスシンプルプロジェクトレポート
 プレビューカスタマイズ
法人事業年次報告書
 プレビューカスタマイズ
テック スタイル ビッグデータ インパクト リストクル
 プレビューカスタマイズ
青オレンジ 3 d ビジネス レポート
 プレビューカスタマイズ
ビジネス四半期レポート プレゼンテーション
 プレビューカスタマイズ
売上報告書
 プレビューカスタマイズ
ビジネス-中間レビュー-レポート-ビデオ
無料編集用の統計ビデオ


なぜ統計ビデオを作成する必要があるのか?

売り上げを伸ばす
訴求力のある動画は、ユーザーの購買行動に強く影響を与え、売上に結びつきます。

トラフィックを増やす
あなたのサイトへのトラフィックを促進するためには、動画コンテンツの力に勝るものはありません。

ソーシャルシェアにおすすめ
ソーシャルメディアプラットフォーム上の動画は、画像とテキストを組み合わせたものよりも多くの「いいね!」や「シェア」を生み出します。
統計ビデオを作成する三つのステップ
- 1
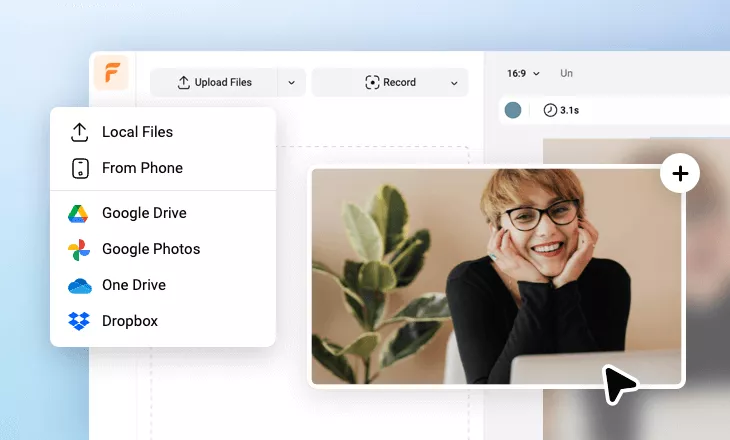
メディアの追加
コンピュータライブラリやストックライブラリからビデオや写真をストーリーボードに追加します。
- 2
カスタマイズ
テキスト、音楽、ナレーションを追加して、あなたの統計ビデオをカスタマイズすることができます。
- 3
輸出
あなたの統計ビデオを様々な比率や定義でダウンロードしたり、オンラインで世界と共有したりすることができます。

統計ビデオを無料且つ数分間で作成する。
無料動画を作る